Everyone has a job in this country! Is this good news for the taxpayer? Well, not necessarily.
When we hear about people getting jobs, we straightaway think this is good. People who work can make ends meet more easily, have better lifestyles, and support their families with greater pride.
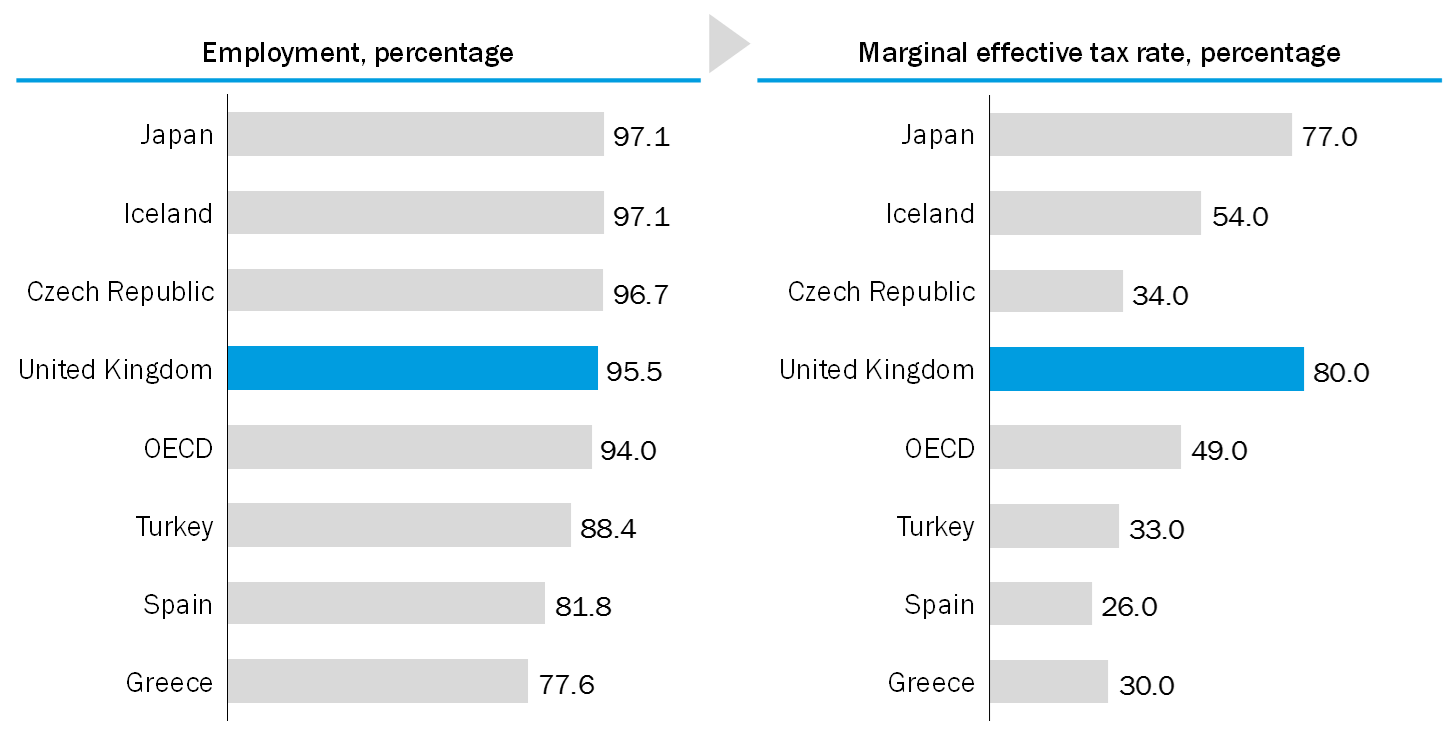
Fact 1: Around 95.5 per cent of the working population in the UK has a job.
People with jobs also do their bit for society: every new job means that the taxpayers’ purse saves on unemployment benefits, and starts receiving new tax.
The trouble with this is that we are forgetting about in-work benefits, which are paid for by the taxpayers and go to those who have the worst paid jobs.
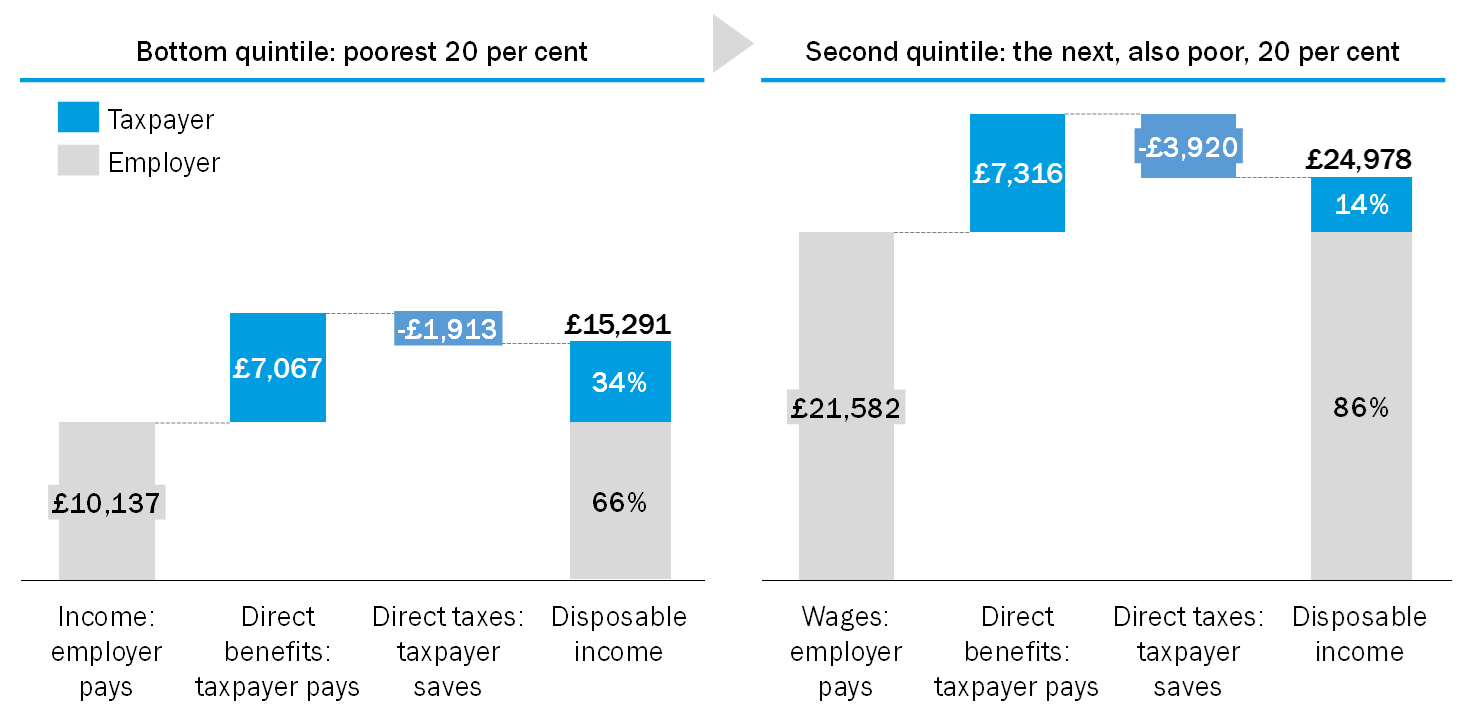
Fact 2: In the UK, over a third of the money available to the poorest with jobs comes from the taxpayers, rather than from the employers
This chart shows that the taxpayers’ help goes down as wages go up.
But how better off is someone on a badly paid job if they get themselves a better job, with a higher wage?
Take someone moving from a part time to a full time job. In the UK, they will lose 80 pence for each new £1 they earn. This is because they will get less in-work benefits, and pay higher taxes.
Fact 3: The incentives to work more in the UK are weak compared to other countries
Help me join the dots:
Facts 1 + 2: Many people with badly paid jobs can make ends meet only because the taxpayers are there to help.
Facts 2 + 3: These people may move on to better jobs, and so relieve the taxpayers’ purse, but there is not as much for them to win as it might look like.
If getting this situation better was easy, I am sure it would have been done a long time ago. The following have a stake in it:
• politicians, who design the tax benefit system
• employers, who set wages and are also taxpayers
• workers, who want to see how longer working hours mean more money in their pocket
• individual taxpayers
One thing is clear to me: getting people into jobs may be better or worse news depending on the country you live in, and the type of taxpayer you are.
The sources for the charts are Office for National Statistics, The effects of taxes and benefits on household income, table 4, non retired households, 2015-16; and OECD, Unemployment rate, 2017 quarter 1; and Tax and benefit systems: OECD indicators.