I think people do not stop to do the maths when they say prevention is cheap. It does hit taxpayers quite hard.
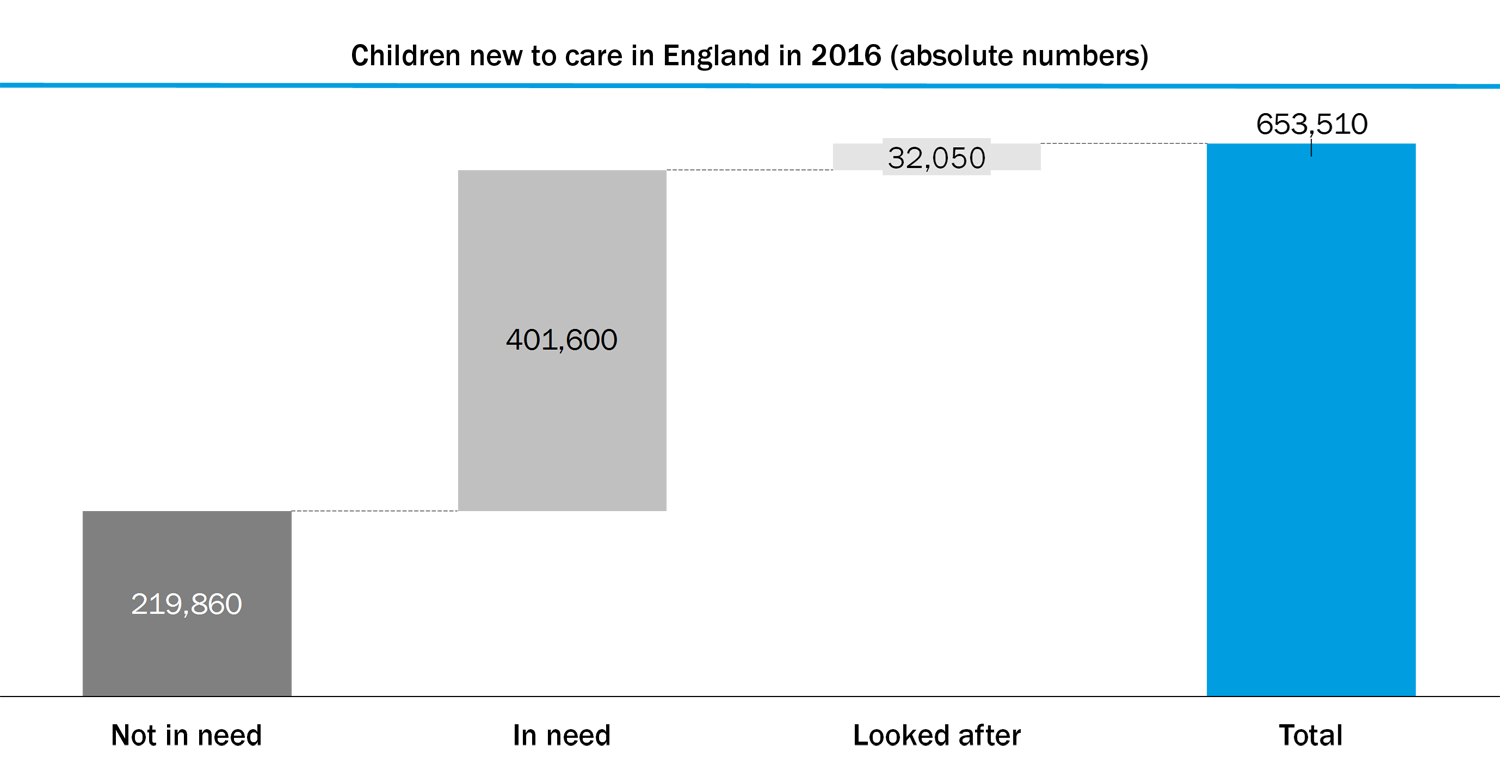
The train of taxpayer funded care carries over one million children. Imagine it only stops once a year. In 2016, over 600,000 new passengers jumped on it. Many others stayed on from previous stops.
Children get support even if they do not meet the thresholds
• Not in need: Some of the new passengers were only allowed on the third class carriage. They were referred to a local authority and the conclusion was that they did not meet the threshold to get ‘in need’ tickets. The third class carriage is run by family services.
• In need: Others did meet the threshold, and were allowed on the second class carriage, which is run by social worker teams.
• Looked after: Finally, the situation of a few merited a first class ticket and started to be looked after by a local authority. Social workers and other specialist practitioners run the first class carriage.
Third class carriages do exist…
Those dedicated to improving children’s lives often make this point: prevention is about avoiding first class tickets, and actually, second class tickets as well.
However, they seem to forget that third class tickets exist. Very few local authorities would admit that those who do not meet the thresholds have to leave the train, or are never allowed to jump on. In fact, prevention happens on the third class carriage.
… and third class tickets are not for free
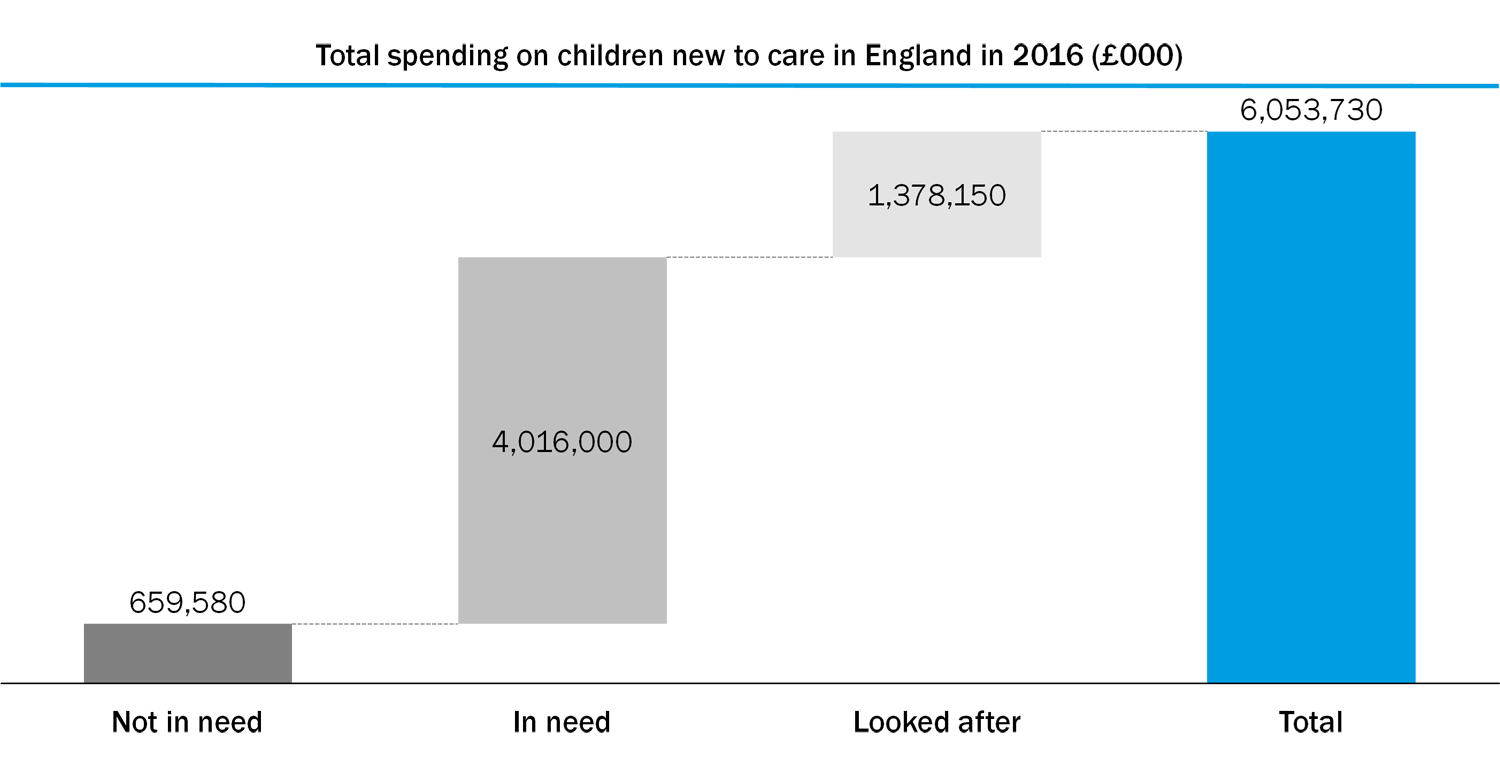
Running the prevention carriage costs over £600 million
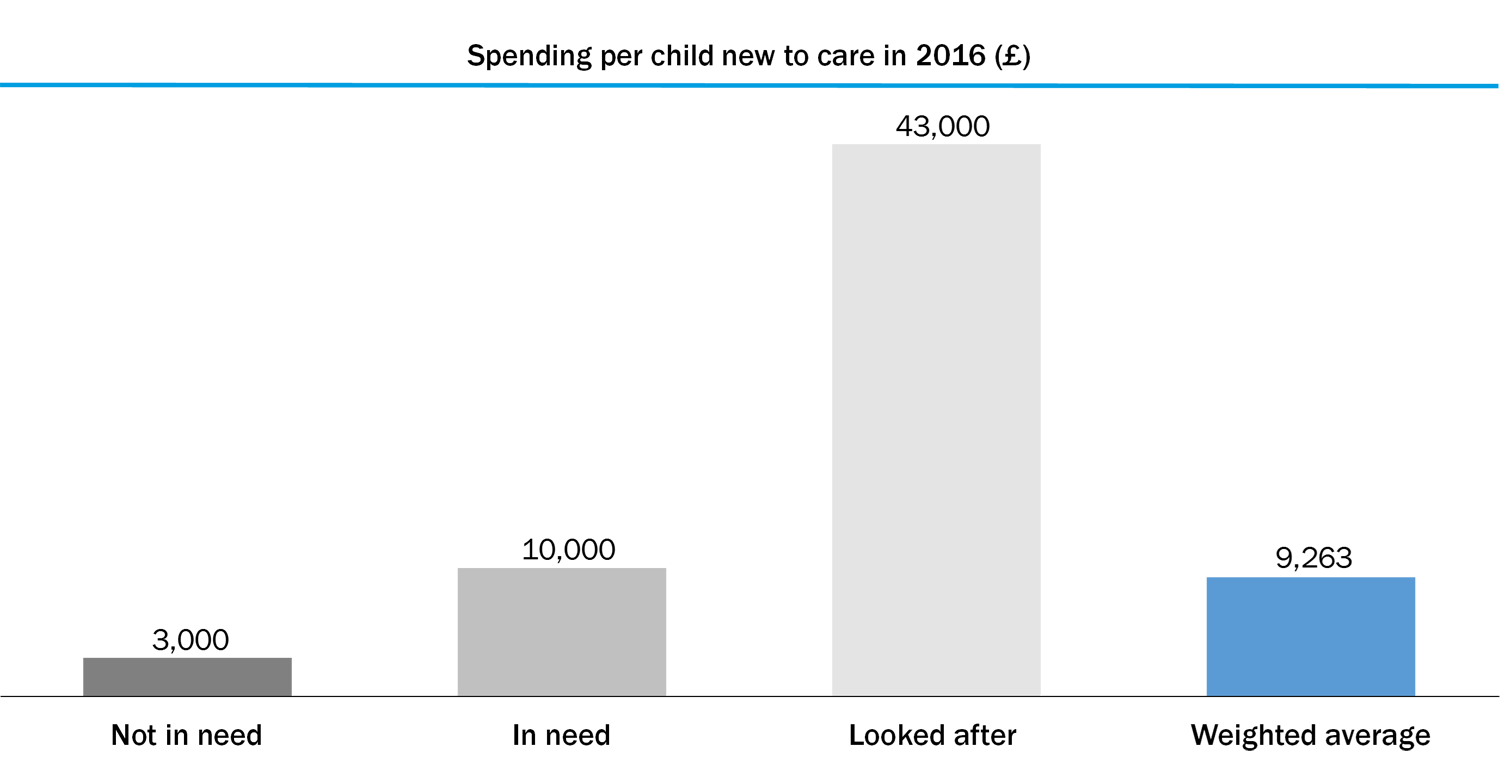
If we multiply the price of each ticket by the total number of passengers in each carriage, we can see that prevention spending is relatively low: about half of that on looked after children, but it still matters: over 1,000 houses could be built with that money.
I hope this blog is helpful for those responsible for public services to see the bigger picture, and make better decisions about prevention.
The sources for the charts are official statistics published by the Department for Education, a summary of over 100 spending estimates my team has gathered over the last couple of years, and this report: Children’s services: spending and delivery.
‘Not in need’ includes referrals that resulted in both ‘no further action’ and ‘assessed as not in being in need’.
Adding up the spending on the new entries to the ‘in need’ and ‘looked after’ categories results in over £5 billion. Total spending for both new entries, and existing ‘in need’ and ‘looked after’ cases from previous years would result in over £9 billion, however this is not represented in the charts.
I have looked at longer term costs in a previous blog.